
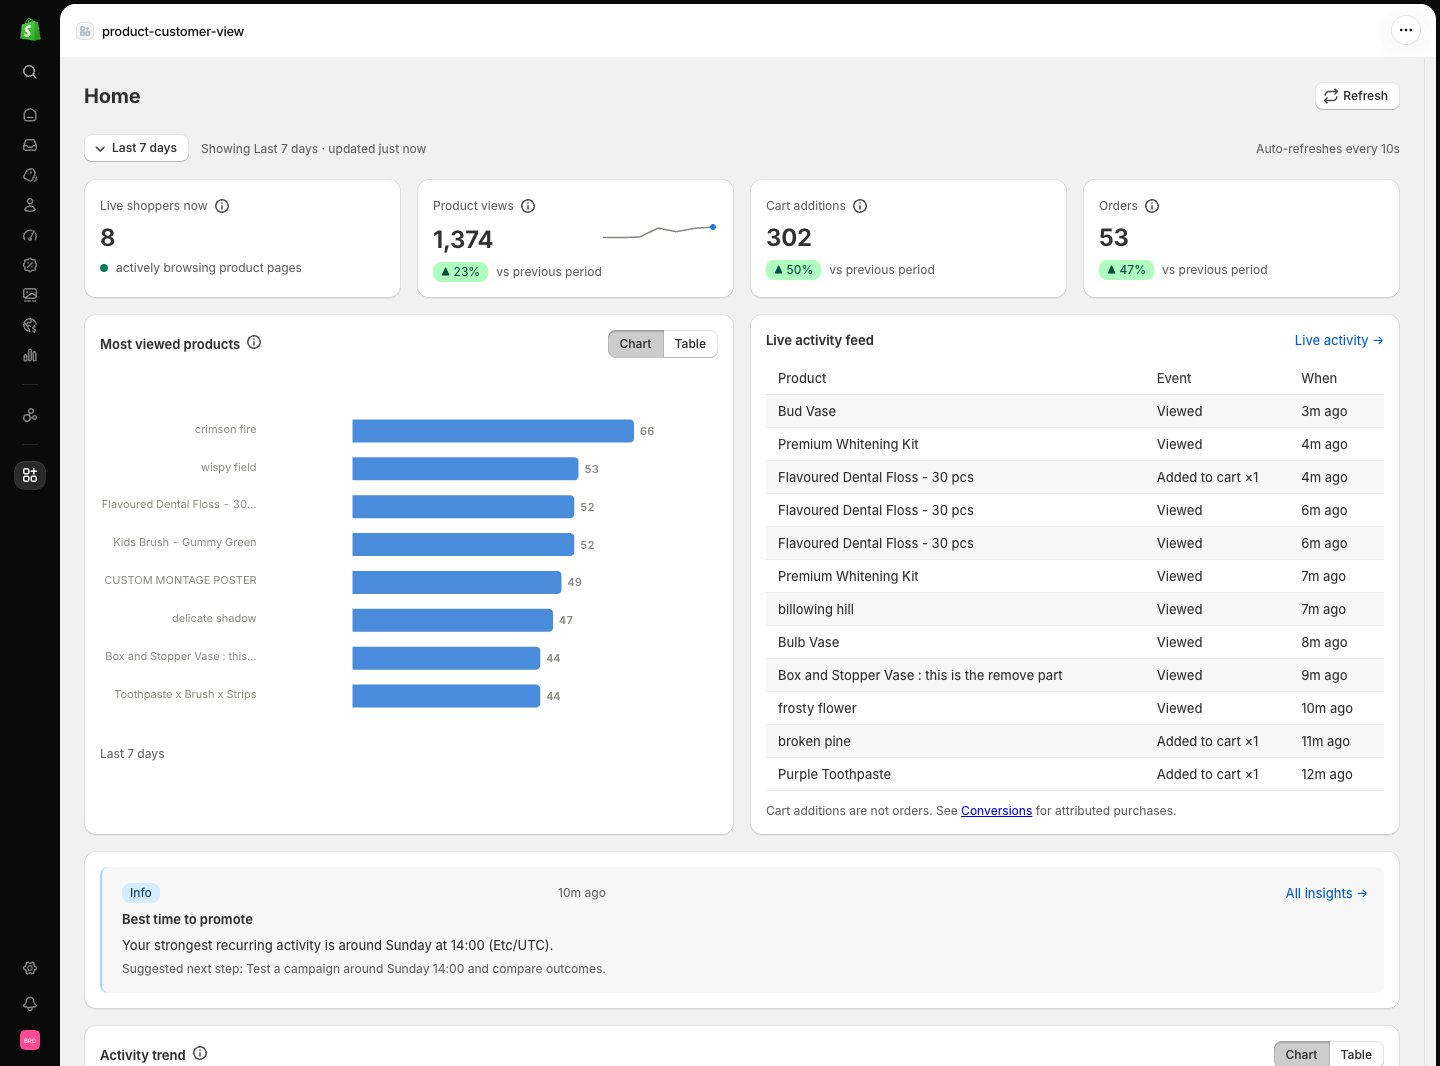
Choose the time window
The filter bar at the top of the page controls every section:- Today
- Yesterday
- Last 7 days (default)
- Last 30 days
- Custom range — pick any start and end date
Live shoppers
The hero card shows how many shoppers are on the store right now. This is the count of active viewers: distinct sessions that sent a heartbeat within the active window (60 seconds by default, configurable in Settings). It is never the same number as views — see Measurement for the distinction.KPI cards
Three cards summarise the selected window:
Each card carries a tooltip with its exact definition and a percentage change versus the previous equal-length period. The views card also shows a small sparkline of how the number moved through the window.
Most viewed products
A horizontal-bar chart ranks products by views for the selected window, backed by a table with the same numbers. The table adds cart additions, orders, conversion, and current stock where that data exists. The conversion column appears only when order attribution is supported for the window, and stock shows a dash for products without tracked inventory.Live activity feed
A running list of recent product views and cart additions, newest first. It shows raw activity as it arrives — product, event, and when it happened.Insight of the period
Below the feed, the dashboard highlights its strongest finding: a severity badge, the evidence behind it with its time period, and a suggested next step. The card stays hidden when nothing clears the evidence bar — findings are never invented. The full list lives on the Insights page.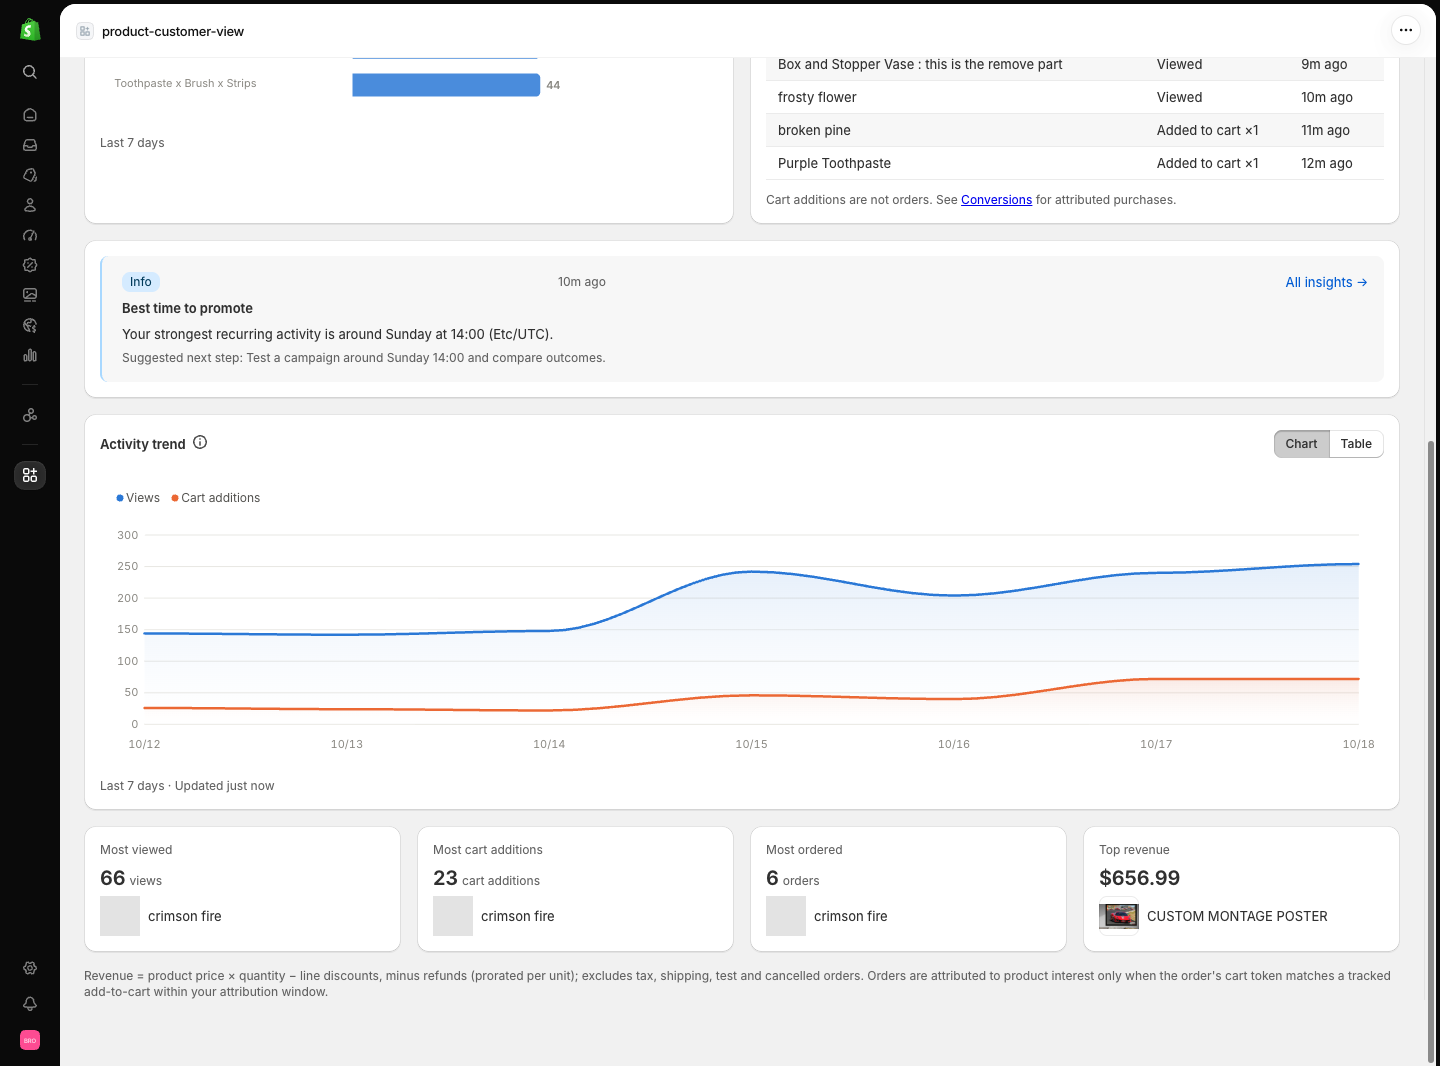
Activity trend
An area chart plots views and cart additions across the selected window. Windows up to three days are bucketed by hour; longer windows use day buckets, so a 30-day view reads as a daily trend. The chart footer repeats the time window and update time.Leaders this period
Four cards name the period’s standouts: most viewed, most cart additions, most ordered, and top revenue. A card shows “Not enough data yet” until that metric has activity in the window.How revenue is defined
Product revenue = line price × quantity − line discounts, excluding taxes and shipping, minus refunds. Test and cancelled orders are excluded. The same definition appears in a footnote on the dashboard itself and in Metric definitions.If the page shows a setup checklist instead of data, the theme embed isn’t
active yet. Follow the three steps shown, or see
Theme setup.
Related pages
- Products — the full per-product story behind the most viewed table.
- Insights — the complete list behind Insight of the period.
- Metric definitions — every number on this page, defined exactly.