
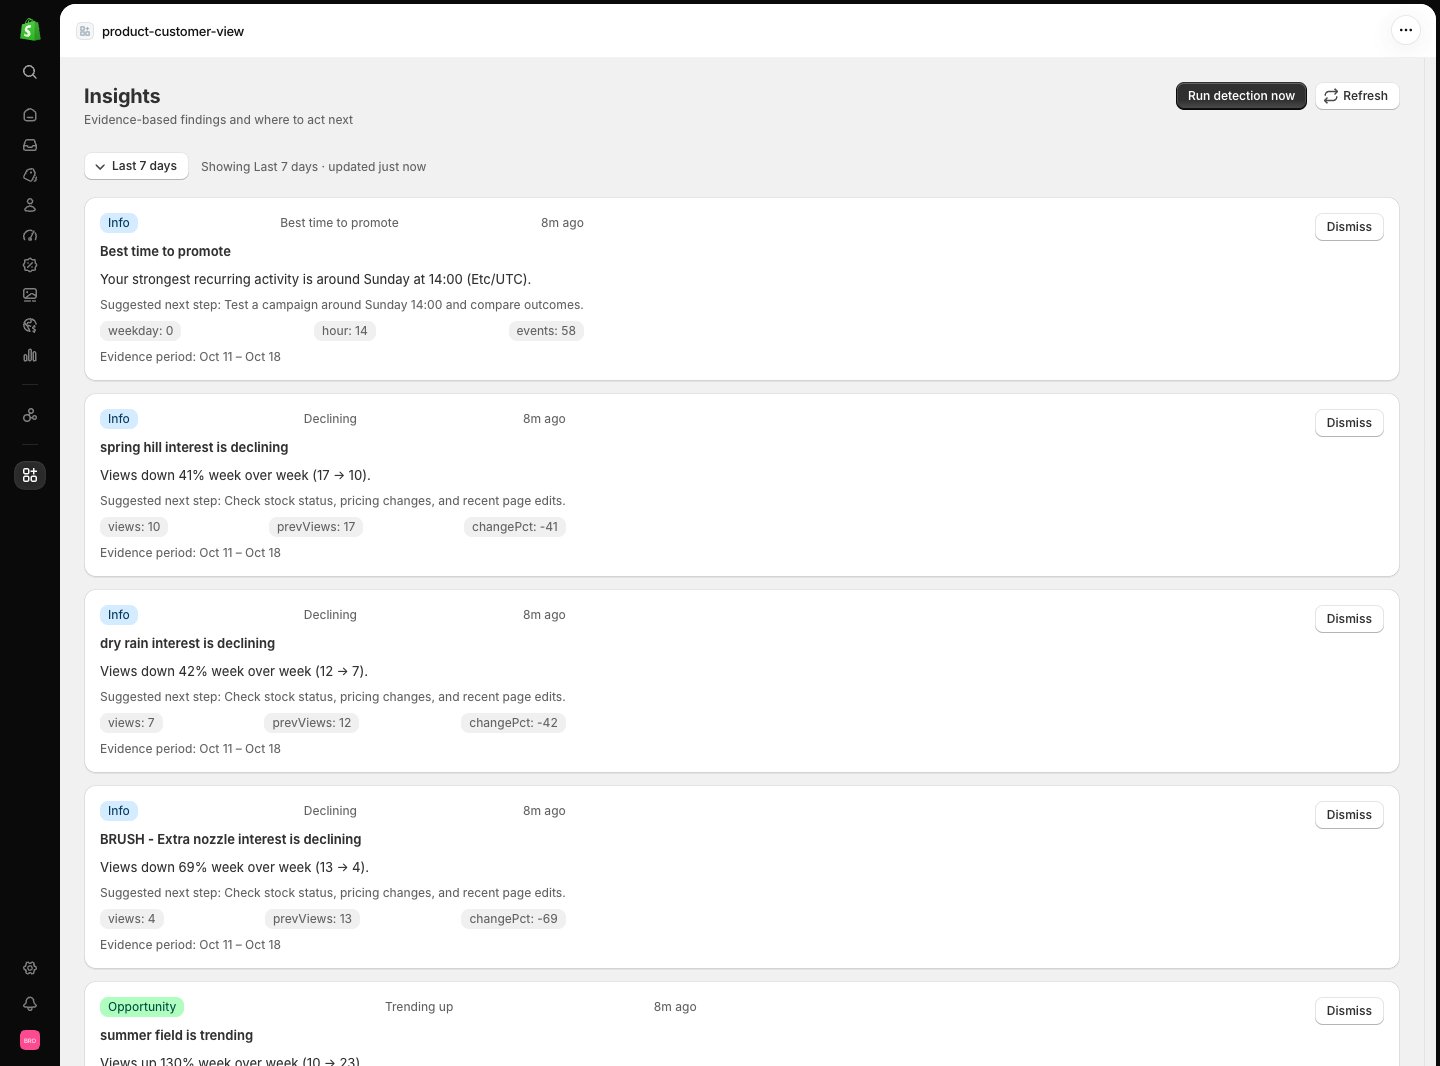
How insights are generated
- Findings are generated automatically every 30 minutes when there is enough tracked data.
- You can also click Run detection now to generate immediately.
- The same type of insight about the same product is suppressed for 24 hours, so the feed stays readable instead of repeating itself.
- A severity badge (opportunity, warning, or info).
- The insight type in plain language.
- The evidence — the actual numbers the finding is based on.
- The time period the evidence covers.
- A suggested next step.
Insight types
Opportunity radar
Below the feed, the opportunity radar ranks products with a combined 0–100 score:
A high score means a product is attracting attention, converting it reasonably well, and running short on stock — the classic case for a restock decision. Empty state: opportunities appear once products get views; nothing is scored before that.
Related pages
- Dashboard — the top insight is surfaced on Home.
- Products — the per-product numbers behind most findings.
- Measurement — the exact thresholds behind every type.